Charts Explained
We get it, charts aren’t the easiest to read at the best of times. That’s why we have our very own charts explained page to help walk you through your initial set up. The following sections will explain how our system works, and how to read the data you will receive in each chart.
Dashboard Explained
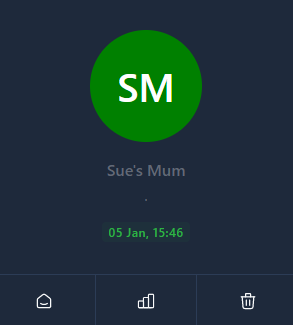
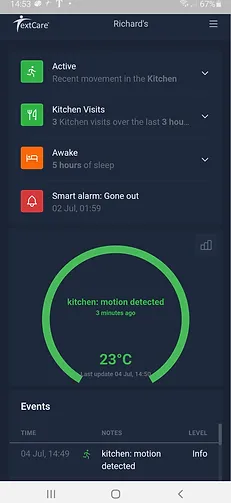
Our dashboard operates a traffic light system, allowing you to see any issues at a brief glance, if all is well and nothing to report or check the indicator will show Green.
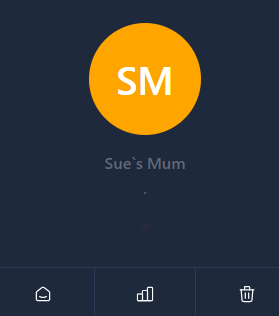
If something out of the ordinary has occurred from the normal routing, for example no movement in the kitchen, or a door opened late at night, the system will show an amber indication
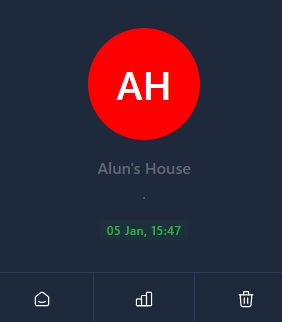
A red indicator will show if the help button is press or a fall has been detected.
The system will also show red if for any reason there is loss of signal.
When you click on the traffic light a summary of last events will be displayed.
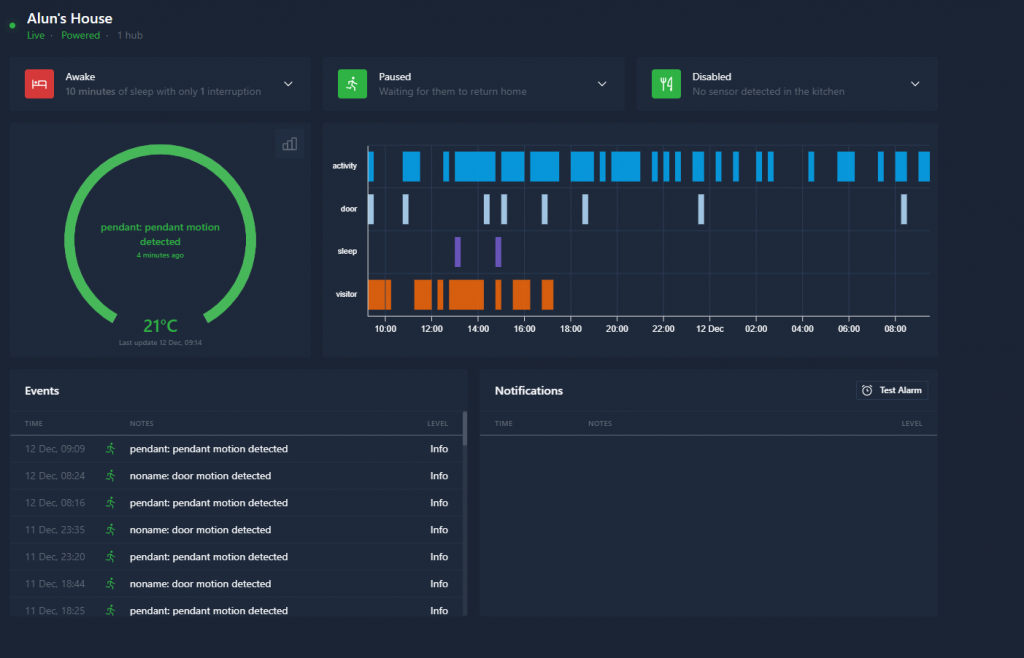
For a more detailed account of each sensor clicking on the graph symbol
Will open up a dashboard with an hourly account of what has been happening around the home.
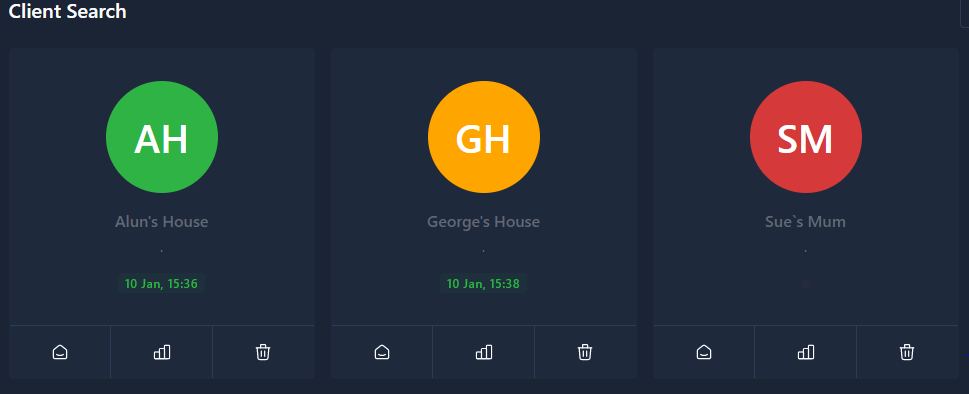
Client Dashboard Explained
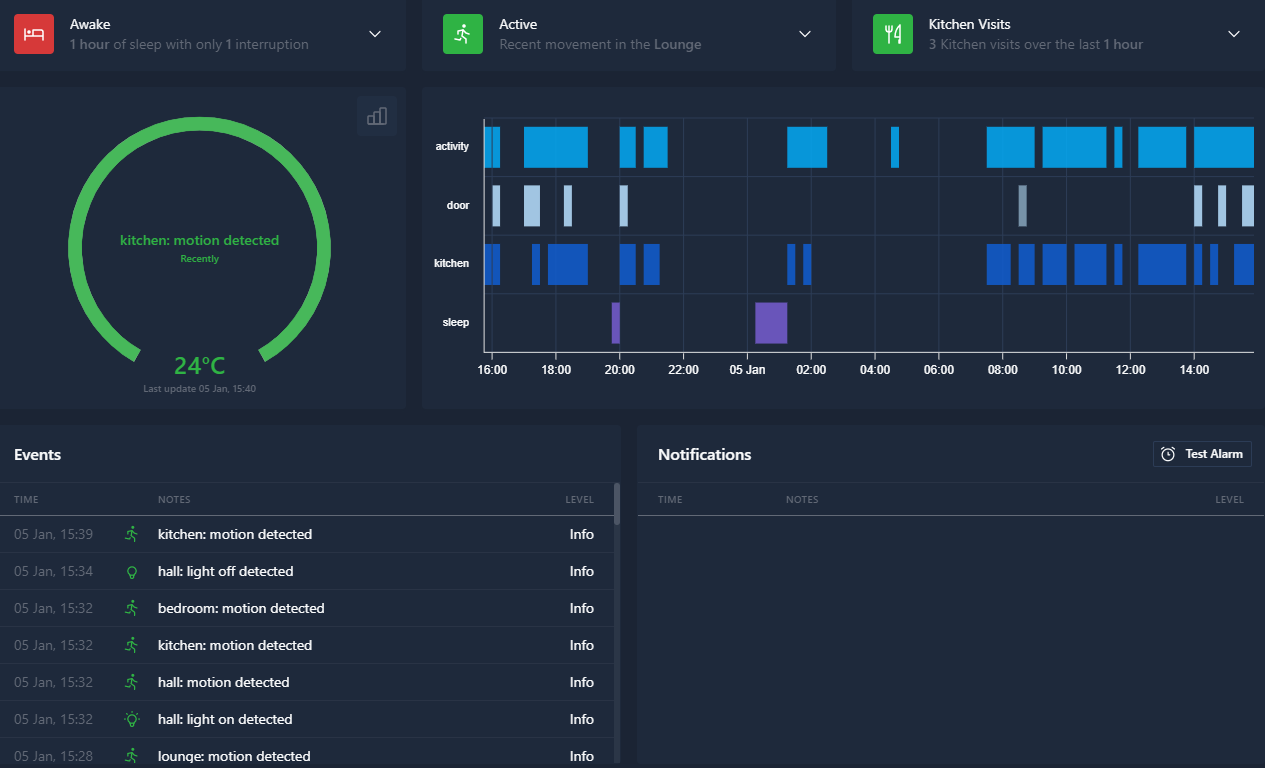
Clicking on a clients dashboard button will bring you to an in-depth page showing an array of information.
Information such as:
temperatures
View what the current temperature is along side the history.
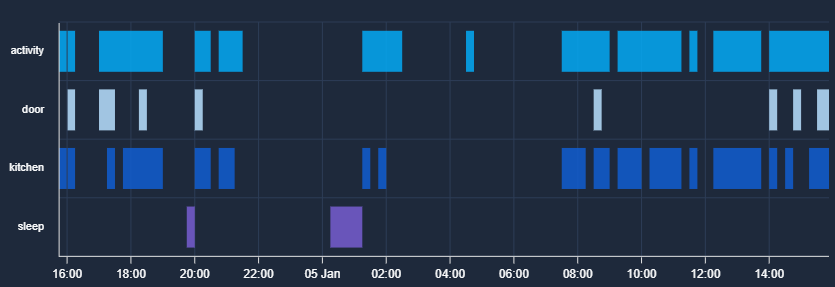
Activity
Using the activity graph allows you to monitor which rooms are frequented & which ones are not
Doors
With your door sensors, you're able to detect when a door has been opened, and at which time. The door sensors can also be fixed to fridge or cupboard doors see help make an assessment of their nutritional needs.
Sleep
Using our technology, and in-depth algorithm we're able to detect how much sleep someone is having.
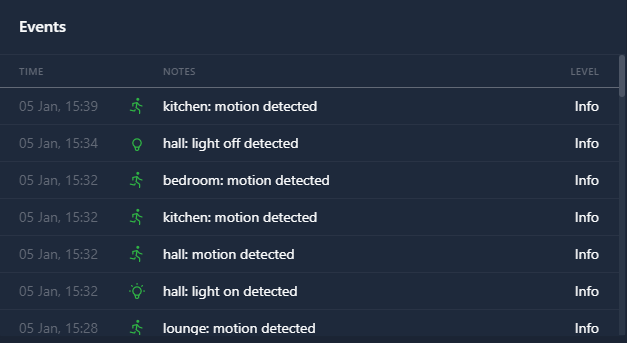
Did we mention all this is displayed in a handy chart showing what time these events happened? You’re also able to view handy information such as event logs and notifications all on the same page
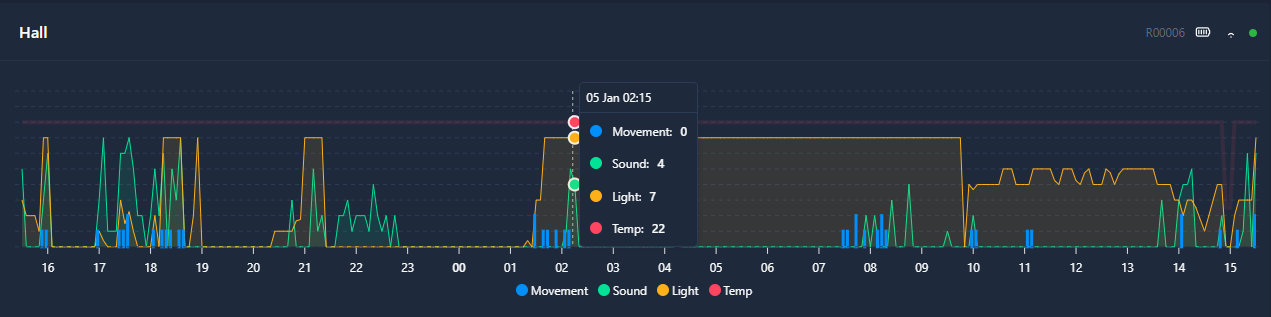
In-depth Charts Explained
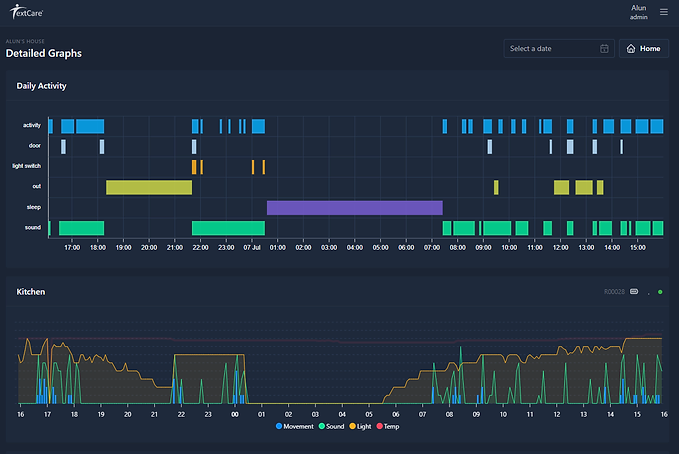
From the detailed graphs page, you’re able to view a much more in-depth analysis regarding each sensor & the activity within the location they are situated
The Detailed Activity gives a summary of the sensors See when door was open, what the temperature was at a given time, when they slept, what time there was noise and so much more.
The individual sensor graphs show in more detail what’s happening within that location.
The below shows how the different sensors can work together to build a picture of events.
Movement , lights being switched on & off with any noticeable sound along with room temperature, all help to understand sleep patterns when a sensor is situated in a bedroom
Ours system monitors battery condition, & when power is low the icon will show in RED
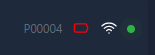
We also monitor power / signal outages, again a notification will be sent should this occur
You’re also able to see what devices may need their battery change, what device is and isn’t connected to the network
Notifications & Alerts
The Alarms are now designed to be intelligent, you can set the level in ALARMS
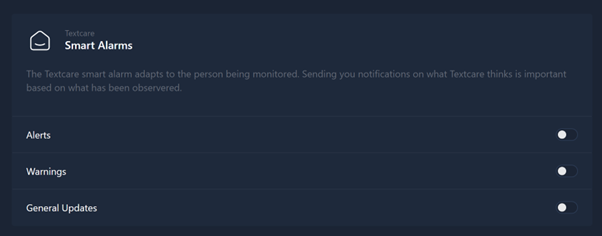
These can be set to be delivered by email or app notification or both, which are easily received on any platform.


The system provides an information stream of what’s happening within the home. The Alarm setting allows you to receive what the AI system decides is general, warning level or alert level. Our intelligent monitoring system has removed the complexity of setting individual alarm cases, & will alert you when the criteria of abnormality thresholds are met.
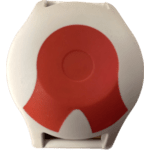
Our pendant when pressed will also alert via notifications or email should it be pressed or a fall be detected.. This can be worn on a lanyard on a wrist strap or just kept in a pocket.